


100 Days Of ML Code — Day 084
Recap From Day 083
Day 083, we looked at Fletcher-Munson Loudness Curves. You can catch up using the link below. 100 Days Of ML Code — Day 083 Recap From Day 082medium.com
What we’re going to talk about today and the next couple days is if we had two sounds that actually have the exact same pitch and the exact same loudness but they sound really different from each other, How do we describe that? So we’ll be talking about timbre today.
Timbre
So in the last couple of days, we looked at loudness and we looked at pitch and I asked the questions of how can we distinguish two sounds that have the same loudness and the same pitch and yet they sound very different. That’s where the notion of Timbre comes in.
Just to start, let’s say I play you the sound of a trombone and then a double-base sound. Same pitch, more or less the same loudness, but it sounds very different. How do we describe the differences between them? That’s what we are going to talk about.
In the coming days, we will look at what is timbre? We will Describe it in terms of two components spectra and envelope and also we will look at some different ways we can look at sound besides the waveform view we’ve been using, that show the timbre of sounds a little bit more clearly.
Let’s talk about the Fourier Theorem which helps explain how timbre works. There are no decent definitions of timbre out there. But let’s look at my favourite definition which comes from the American Standards Association and this is how it goes. It says, “that attribute of sensation in terms of which a listener can judge that two sounds having the same loudness and pitch are dissimilar”.
The language in the definition above is a little fancy but basically what it’s saying is. If they’ve got the same loudness, and they’ve got the same pitch, but they still sound different to you, well, that’s timbre. So basically it’s just a grab bag of everything else about a sound that can’t be described by its loudness and pitch.
The definition above is really just saying what it’s not rather than what it is. Colloquially we tend to define timbre as the colour or the tone or something like that, and that’s fine because It gives us a general sense of what we’re talking about with timbre, but it doesn’t get into a specifics it’s really just a metaphor. They explain, in this vague way, this other stuff that we don’t really have a good way to describe.
The way we’re going to talk about timbre going forward is in terms of two key components, spectra and envelope. So I’m going to talk about this in a little bit more detail. In order to do that we really need to look at visual representations of sounds. Remember that up to now we’ve been doing the waveform representation of sounds, where our X axis is time and our Y axis is amplitude.
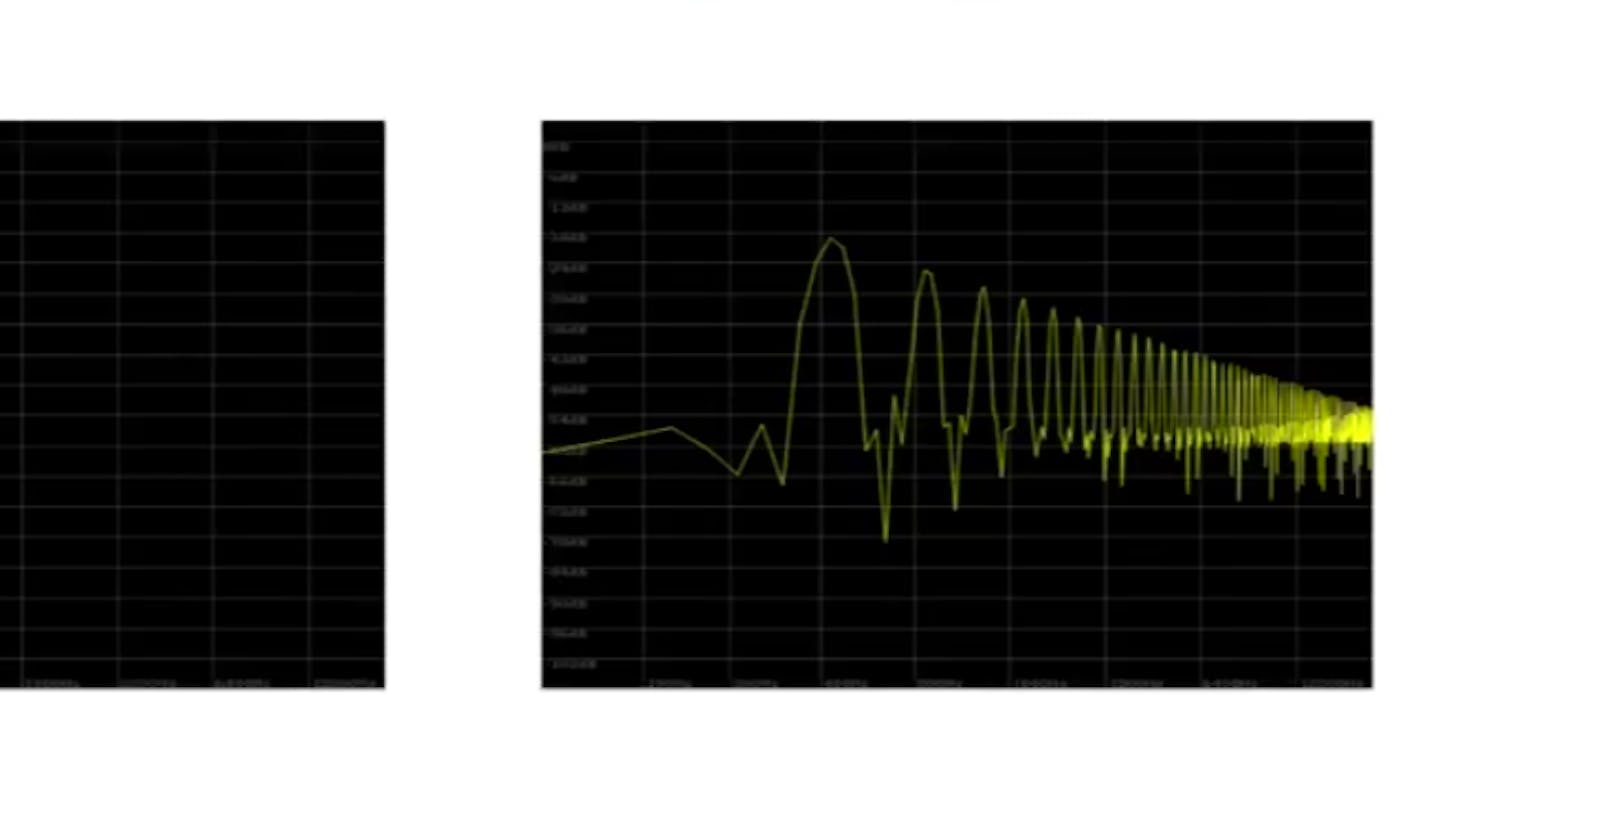
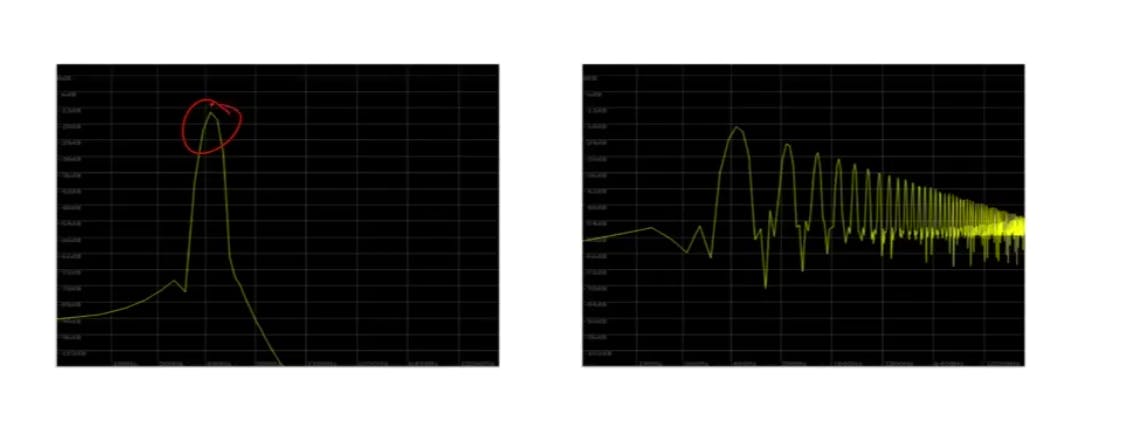 sound spectrum
What we have in the image above is a sound spectrum, a visual spectrum representation of sounds which is basically showing where there’s energy in different frequencies. So what we have on our x-axis is frequency and our y-axis is decibels. And so we can see in the one on the left, it is a sine wave at 440 Hertz. It’s a little hard to read the units on the diagram above but it is 440 Hertz on my x-axis and you can see the peak right there(the area highlighted by a red circle in), showing that the sine wave’s peak energy is at the 440 Hertz point.
That’s all for day 084. I hope you found this informative. Thank you for taking time out of your schedule and allowing me to be your guide on this journey. And until next time, be legendary.