


Recap From Day 033
In day 033, we looked at working with audio input: Common audio features. We saw that for relatively constraint sets of inputs sounds, we’ll be able to build a decent pitch classifier or maybe timbre classifier using just the FFT magnitude values. But if we want to make sure that every feature we use is relevant and informative, while also avoiding having a huge number of features, we can often do better than just the raw FFT.
Today, we’ll continue from where we left off in day 033.
Working With Audio Input: Common Audio Features Continued
Spectral Centroid
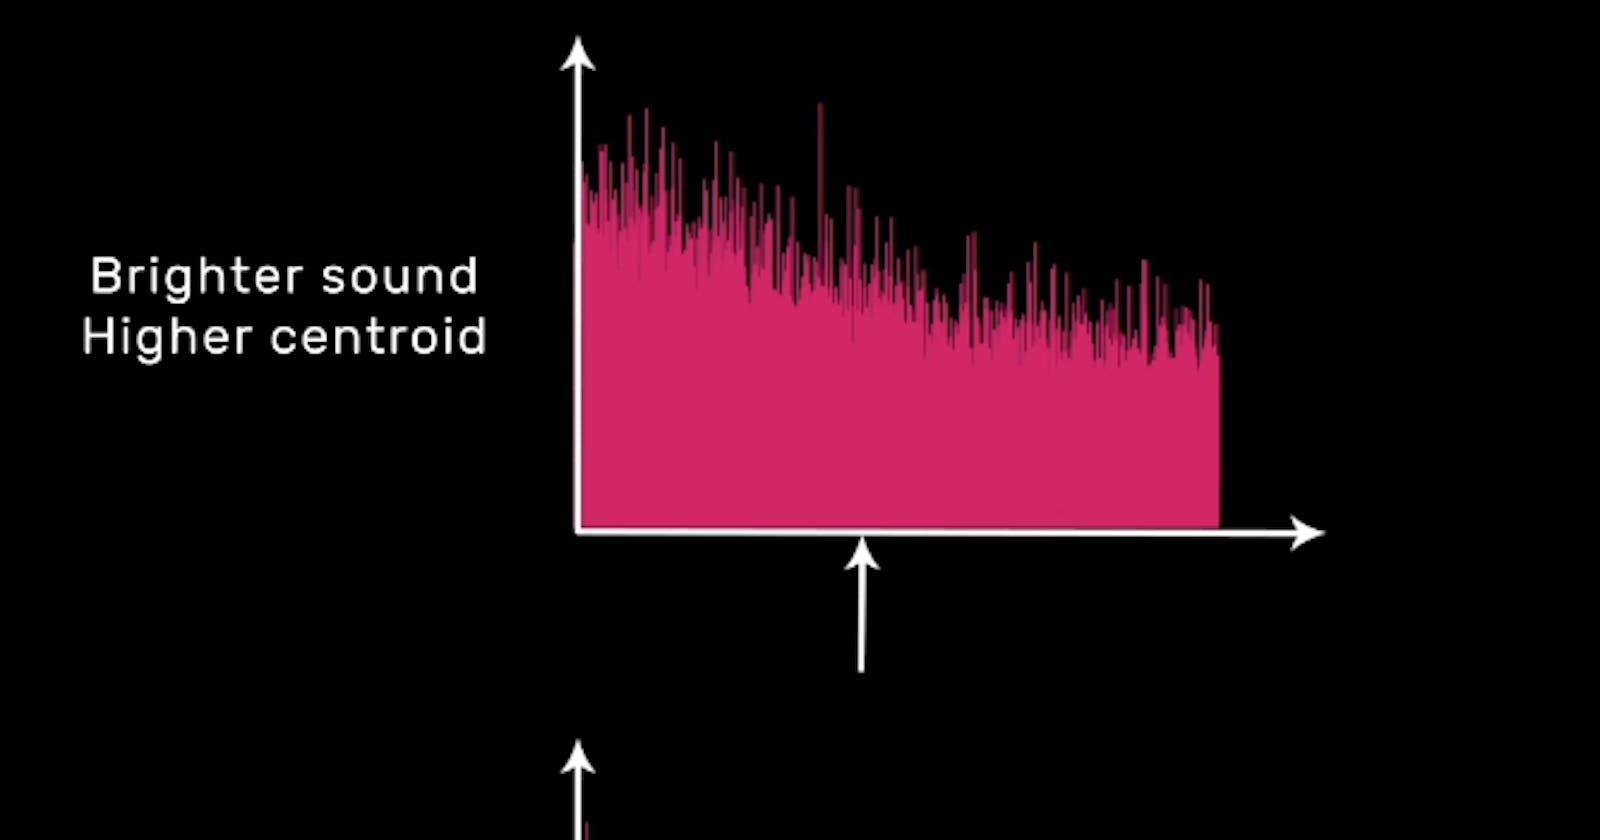
Another simple and super-useful feature based on the FFT is the Spectral Centroid. “The spectral centroid is a measure used in digital signal processing to characterise a spectrum. It indicates where the “center of mass” of the spectrum is located. Perceptually, it has a robust connection with the impression of “brightness” of a sound”
Spectral Centroid tells us something about the timbre of a sound. Specifically, it gives us information about how bright a sound is. Visually, you can understand Spectral Centroid by imagining you have a frequency spectrum made out of solid object. The Centroid lies just under the center of mass of this object.
](https://cdn-images-1.medium.com/max/2000/1*avhQsNW_O6oLzux9BSJfEw.png)
If you were to balance this object on the tip of your finger, where would your finger need to be? as shown in the diagram below, if a sound has more high-frequency content, it will tend to sound brighter, and our Spectral Centroid will be higher. If our sound has more low-frequency content, it will tend to sound warmer, and our Spectral Centroid will be lower.
](https://cdn-images-1.medium.com/max/2000/1*p4eVS5zcoKoUnE3bmdczqA.png)
Spectra Centroid can be a nice feature if timbre is relevant to the thing you are trying to model. For instance, instrumentation or musical genre, but even vocal quality of different speakers or singers. If you want information about pitch or timbre, but the peak frequency and Spectral Centroid don’t give you enough information, there is a nice middle ground in between those very simple features and using the full set of FFT magnitude values. That is what we’ll look at next.
It’s good to know that you’re still here. We’ve come to the end of day 034. I hope you found this informative. Thank you for taking time out of your schedule and allowing me to be your guide on this journey. And until next time, remain legendary.
Reference