


Recap From Day 030
In day 030, we looked at working with audio input: Common audio features. We learned that one of the most exciting things about machine learning is that it makes it possible for us to build systems that respond to more complicated types of inputs, like real-time audio and video.
Today, we’ll continue from where we left off in day 030.
Working With Audio Input: Common Audio Features Continued
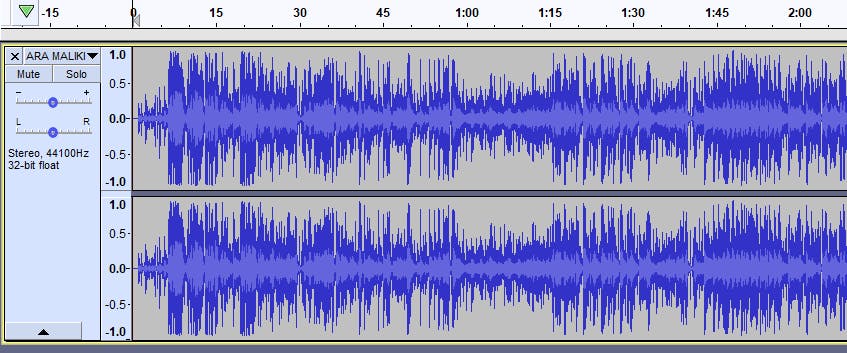
Below is a waveform. A waveform is the shape and form of a signal) such as a wave moving in a physical medium or an abstract representation. You can think of the waveform below as a digital record that tells the computer how the sound pressure level in that sound recording is changing over time.
 Waveform Of A Sound File
To be more specific, a waveform is depicted by a graph that shows the changes in a recorded signal’s amplitude(Volume) over the duration of the recording. The amplitude of the signal is measured on the y-axis(vertical) and time on the x-axis(horizontal)
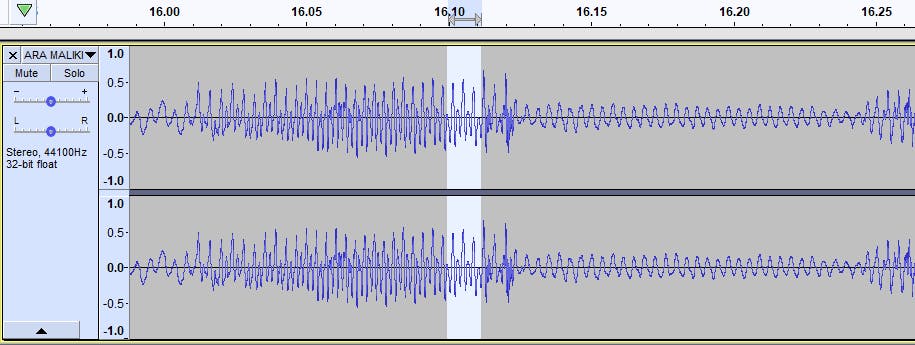
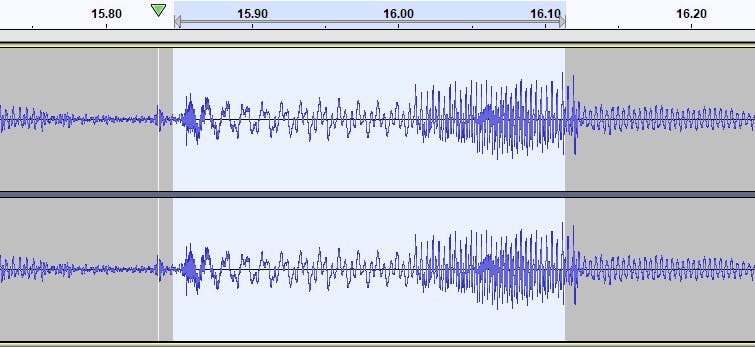
If I take the waveform above and zoom in, and in and in, you can see that the waveform is moving at a very fast rate. The section highlighted in the image below shows the recorded sound over a period of 16 seconds.
 Zoomed In Waveform
If I keep zooming in, I can see the individual sample values as shown in the image below.
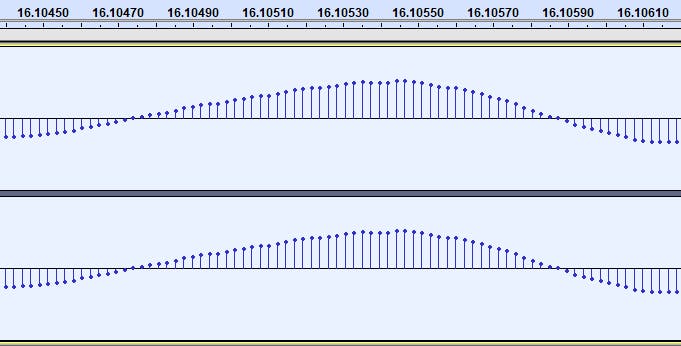
The computer has stored the sound pressure level of the sound file at precise moments in time. Those dots, in the image above. It hasn't stored any information about what happens in between those dots.
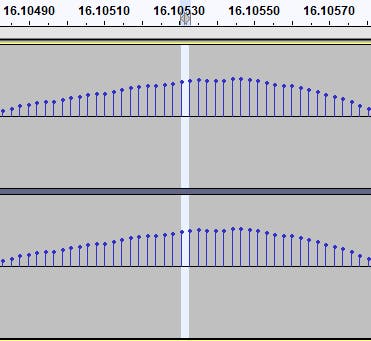
When you work with digital audio like the one we’ve seen above, the default is often to store 44,100 of those sample values per second. The point here is that, if we took an individual sample value, say this one in the image below, it doesn’t tell us very much. And if we were to play it back, we would hear nothing.
 An individual sample value
Audio is only really meaningful to us as humans when the sound pressure level changes over time. So, in order for us to build a computer system that makes sense of sound, we’re also going to have to show the computer how sound is changing over time.
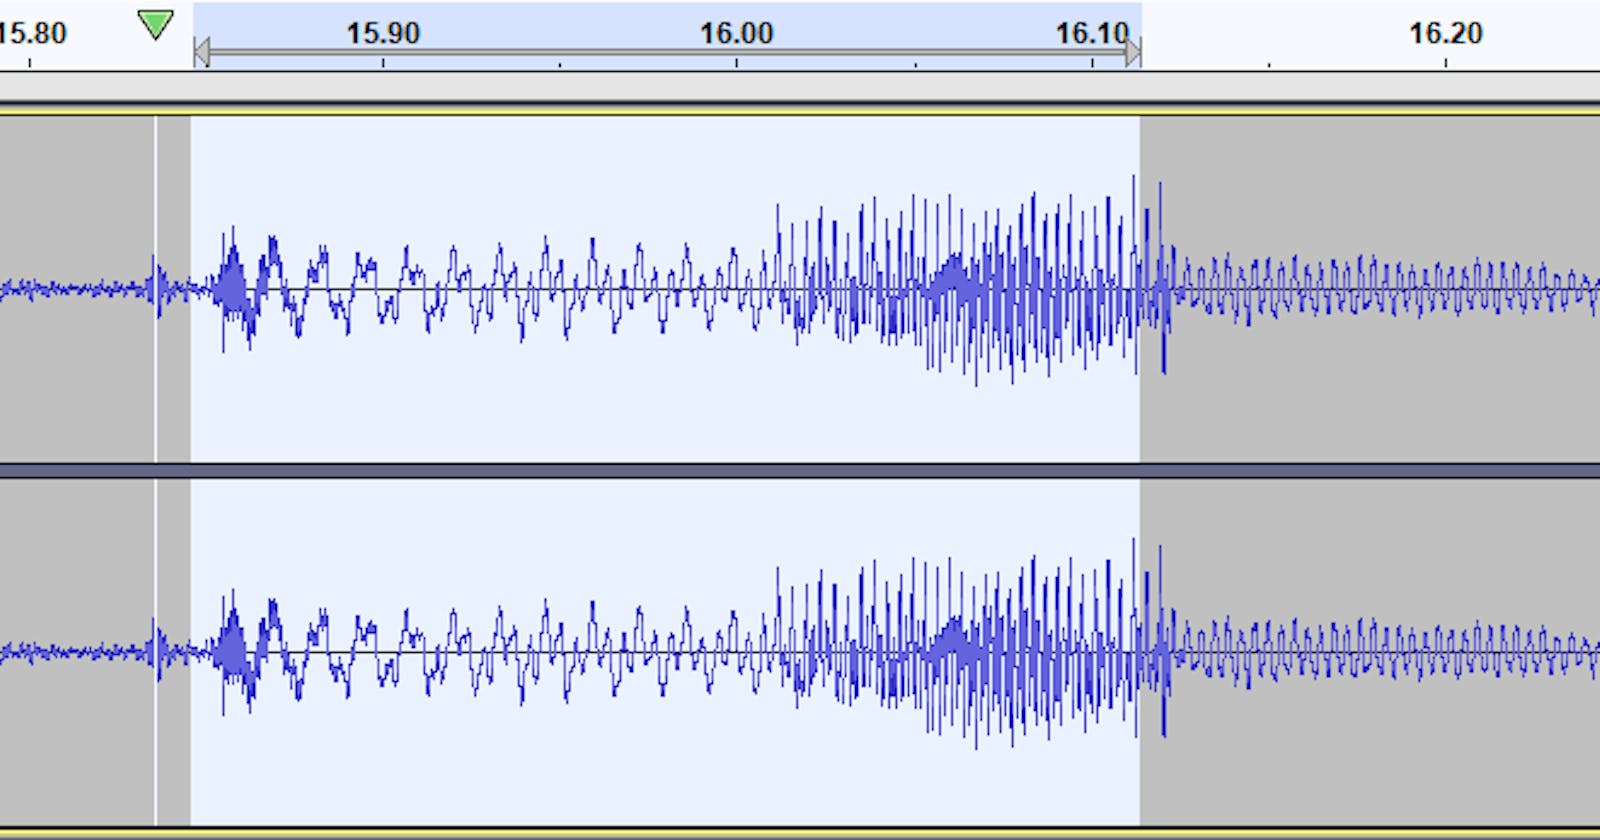
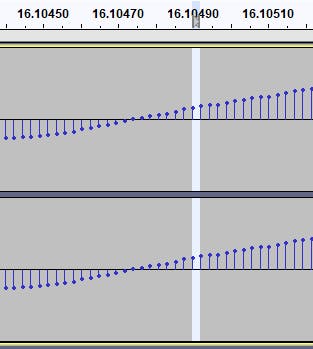
If we want to say something about the pitch or loudness of the sound that will be perceived at the point highlighted in the image below in the audio file we’ve been using, we’re going to have to look at how the sound signal has been changing recently.
We may have to go back to the points shown in the image below.
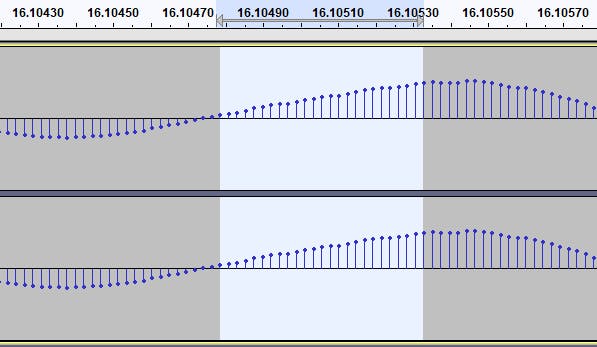
In fact, if we want to say something useful, we probably need to go back even further, like maybe to the are highlighted in the image below, or even earlier.
The selection or snippet of the audio above is often called an analysis window, or an analysis frame. This frame might be on the other of a few dozens to a few thousand samples, or sometimes even longer.
Wow! We’ve come to the end of day 031. I hope you found this informative. Thank you for taking time out of your schedule and allowing me to be your guide on this journey.
Reference